







The measurable effect of an IEMT session visualized.
Anne ten Brinke and Vera van der Laan gave several IEMT sessions at the Brain Clinic in Wamel, during which the brain was measured before and after using a QEEG scanner. Luuk van Leur, director of the Brain Clinic (Center for Neurofeedback), was so enthusiastic about the remarkable results of IEMT that he wanted to collaborate on our scientific research. He mentioned that he had never seen such a remarkable change in just one session before.
Below you can see anonymized images of the QEEG brain scans before and after an IEMT session.

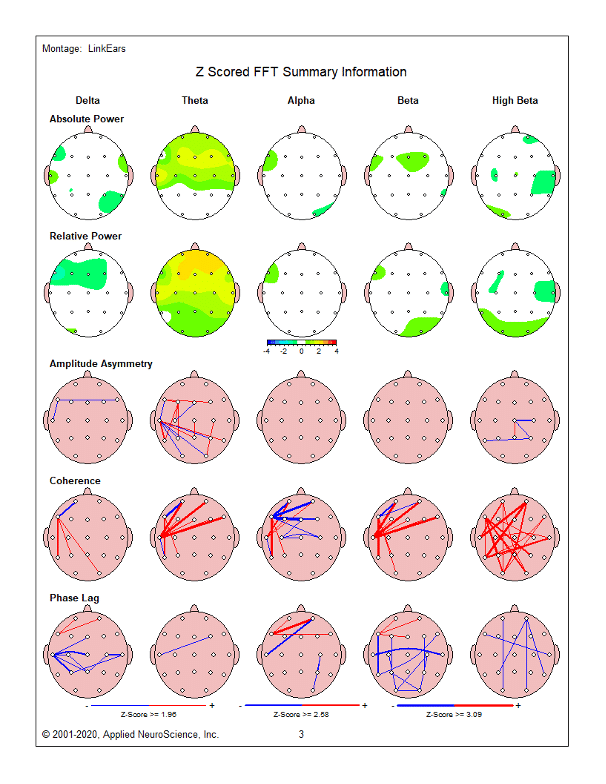
What do you see in these images?
The top two rows provide a general impression of the brain's health in different areas. Here's an explanation of the images:
For the first two rows: The whiter, the healthier. In the first row of the very first image, you can see hotspots near the ears before the session starts. These spots correspond to the activity of the amygdala. The first image shows significant emotional unrest. In the post-session image, you can see much less activity in the same area. In the first row, in the high beta frequency, there is a circle in the middle that corresponds to the brain's control center. A lot of energy is directed there.
In the post-session image, you can see that this area has almost disappeared. In both the first and second rows, after the session, you can observe a much calmer and healthier brain pattern overall. In the bottom three rows, pink indicates the standard healthy color. The lines in these images represent the connections between brain regions where there is either too much or too little energy. Where the balance and connections in the brain are good, you won't see any lines. The lines are blue when there is insufficient connection between brain areas and red when there is excessive activity in the connection. According to the director of the Brain Clinic, the post-session image with many lines in high beta frequency shows that the brain is still very active in processing.
This is a result of immediate measurement after the session. Based on this data, neurofeedback is used to adjust which connections should be trained and which connections should be unlearned. You can get a good overall understanding from these images: IEMT not only reduces emotional unrest but also promotes restoration of connections and balance in the brain.
The measurable effect of an IEMT session visualized.
Interesting data. Is this an article we have permission to share more widely (ie through our own external posts)?
Yes definitely you can share the article externally Martin.
Hi
This is really interesting, can I copy and paste on my website, or just share the link on this website?
Sharing the link is most welcomed. Thanks.
Great thank you.